
About CoolingSpots
CoolingSpots shows for free where it is cool or shady in the heat: forest, swimming spots, gorges, waterfalls, caves, mountains with hiking trails. No account, no sign-up.
Free, no account From open data
Who is behind the map
I am Beni Schäublin, a software architect from Thurgau. CoolingSpots started in June 2026, after two weeks of heat without a break.
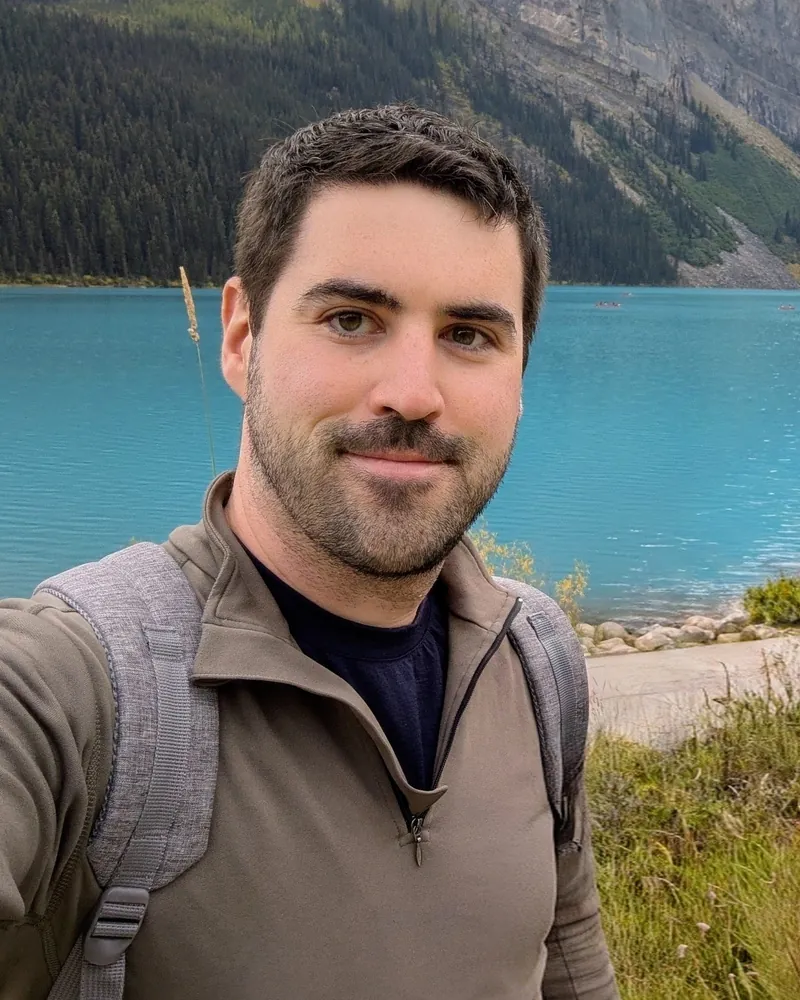
I walk my dog in the forest almost every day because it is cooler there. I noticed that the forest is not equally cool everywhere, and the usual maps do not show that. That raised the question of whether it could be worked out from data.
Behind the map are one person and open data. The focus is on natural places: forest, water, gorges, altitude. If partner programmes one day cover the costs, the map stays free for everyone.
A few cities abroad now design their own maps for their area. But it makes little sense for every city and municipality in the world to build its own platform: one central map gets people to the right places faster. Cities and municipalities can embed CoolingSpots for free, add their own cool places and make the map part of their heat precautions. On top comes what no administration can supply: people who know their cool places. The path under old trees or the steps by the stream appear in no open data. Anyone who knows such a place can suggest it.
For towns and municipalitiesPrinciples of this site
- Honest rather than impressive
- Coolness is grouped into levels, not degrees. An exact temperature would be a promise that cannot be kept.
- Free
- For every visitor, and equally for towns and municipalities that embed the map or use it as inspiration. No account, no login.
- Data minimisation and privacy by default
- Your location is never stored or passed on.
- Open data
- All data comes from open sources (ESA WorldCover, Copernicus, OpenStreetMap, swisstopo) and is visibly attributed - details under "Licences and sources".
In use and in the media
Where the map is in use and where it has been written about.
In use at, among others



Mentioned by
 Showcase on the federal open data portal
 Article of 10 August 2026
 Article of 13 August 2026 on the Winterthur map
 Podcast episode 41, 20 August 2026
Methodology: where the coolness level comes from
How coolness is calculated
The coolness level comes from real map and satellite data. This is what makes a place cool:
Shade: canopy or terrain shade blocks the sun - a dense leaf canopy (crown density from satellite data) or a deeply incised, north-facing site count the same. Water: being close to a stream or lake cools the air. Terrain: higher ground is cooler. Glacier: nearby ice brings cold air. Built-up: lots of built surfaces around store heat and subtract. Cave: inside the rock the temperature stays cool all year.
You get a clear coolness level from slightly cooler to distinctly cooler, along with the reasons behind it.
Reading the map
- The cooler a place, the bigger and darker its marker - the three levels match the legend.
- The symbol in the marker shows the type of place: conifer for forest, broadleaf trees for park, waves for swimming spots and pools, plus dedicated symbols for waterfall, gorge, cave, highland (mountain) and cemetery (flower).
Tapping a marker opens the details with the coolness reasons - including directions and sharing. Getting there: as soon as you share your position, the place sheet shows the straight-line distance, the direction and - from 100 metres of difference upwards - how much higher or lower the place lies. Straight line means: the real route is always longer. We do not show travel times, because we do not compute routes.
Details: formula, data sources and limits
The score is arithmetic on open data: counting pixels, computing distances and angles. No trained model. Caves are the exception.
- Scored places: forests, parks, cemeteries, swimming spots, waterfalls, gorges, caves and highlands from OpenStreetMap. Areas count from 5 ha, cemeteries from 2 ha, each as one point. A forest or park only appears with evidence of coolness: tree canopy from 40%, terrain shade, water in immediate proximity, a nearby glacier, or an elevation from 2000 m. Swimming spots and caves always appear.
- Tree canopy: ESA WorldCover, a free land-cover map in which every 10 m pixel carries a class (tree, grass, cropland, built-up). Tree pixels are counted in a window of 21 by 21 pixels around the place: 380 out of 441 gives a canopy of 0.86. The grid is defined in degrees; the window measures about 195 m north-south and, depending on latitude, 110 to 160 m east-west.
- Water: distance to the nearest stream or lake (OpenStreetMap), searched up to 500 m. The effect halves roughly every 100 m.
- Terrain: elevation from the Copernicus elevation model. The value rises linearly from 300 m and is full from 1500 m. Air cools by about 6.5 degrees per 1000 m of elevation.
- Built-up area: share of residential, commercial and industrial land (OpenStreetMap) within 200 m. Built-up surfaces store heat and lower the score.
- Terrain shade: if a place lies markedly lower than its surroundings (eight directions within a 500 m radius, from the elevation model) or on a north-facing slope, that counts towards the same shade factor as tree canopy. Treeless places such as gorges and north slopes thus reach a coolness level.
- Glacier: ice less than 2 km away adds up to 10%, decreasing with distance.
- Caves: a fixed value instead of a measurement. The rock conducts the annual mean of the surface inwards. On a hot day cave air sits far below that - further than canopy or water ever reach. Hence level 3. The base value is 72 out of 100, plus elevation, because the annual mean falls with altitude. Source: karst research on heat conduction in rock (Dominguez-Villar and others, 2023). At the entrance the temperature varies with the weather.

Score = 40% shade + 30% water + 20% terrain - 20% built-up, plus a glacier bonus of up to 10%. Levels follow fixed thresholds: from 66 out of 100 level 3, from 48 level 2, below that level 1. Fixed thresholds mean a level says the same thing everywhere, including the lowlands. The badge "Cooler than its surroundings" marks places cooler than most within roughly 12 km.
Limits: the levels are an ordinal comparison, not a thermometer, so no degree values are given. The zero point of the scale is an open, low-lying place with no canopy, no terrain shade and no water nearby; built-up ground subtracts further. What is meant is the benefit on hot days: in mild weather the difference is small, because little solar radiation is being blocked. Places near a threshold can fall on either side. The value describes the typical, naturally occurring coolness of an area from static data, not the shade at a given hour. The surroundings are measured in a window of roughly 130 to 200 m, so the statement is regional rather than street-level. Above the tree line, sparse mountain forest can be overestimated. Intermittent and seasonal watercourses are excluded, because small streams carry little water in dry periods. A narrow gorge is shaded by day but traps heat at night - daytime coolness is what is meant.
Contact
For other enquiries, feedback or wishes, an email is enough.
[email protected]